I built this regression model as part of my Data Science Certificate at the University of Toronto to answer a core business question: Which customers are most worth the investment of a loyalty program, particularly at the “Do” stage of Avinash Kaushik’s See-Think-Do framework, and why?
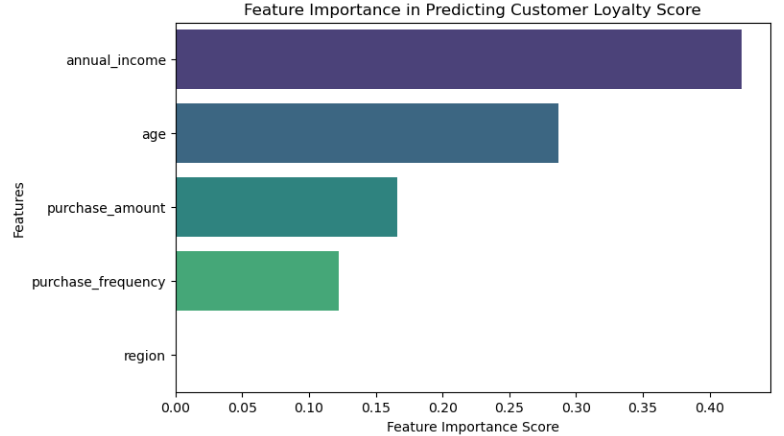
Using a dataset of 238 customer records (age, income, region, purchase behavior), I built and compared linear and random forest regression models in Python (scikit-learn). The Random Forest achieved an R² of 99.9%, with annual income emerging as the strongest loyalty driver—followed by age, purchase amount, and frequency.
To me, this isn’t just a model, it’s a glimpse into how data can drive smarter targeting, better retention, and measurable business impact.
The Business Problem –
Companies invest heavily in loyalty programs, but without clarity on which “Do stage” customers are worth the investment, budgets can leak into low-value segments.
This model helps marketing and business teams:
- Identify loyalty-driving factors
- Tailor retention strategies
- Improve targeting and resource allocation
While the dataset was limited in size and scope (no date/time data, possible single-store bias), the approach can be adapted for larger-scale customer segmentation.
Stakeholders Involved –
- Marketing Teams: to segment audiences and personalize outreach
- CRM Managers: to optimize loyalty programs and offers
- Business Strategists: to identify which regions or income segments yield higher LTV
Methodology –
1. Data Cleaning & Preprocessing
-
Checked for missing values with
.info() -
Encoded
Regionas a categorical variable -
Used
.describe()to identify outliers and get summary stats
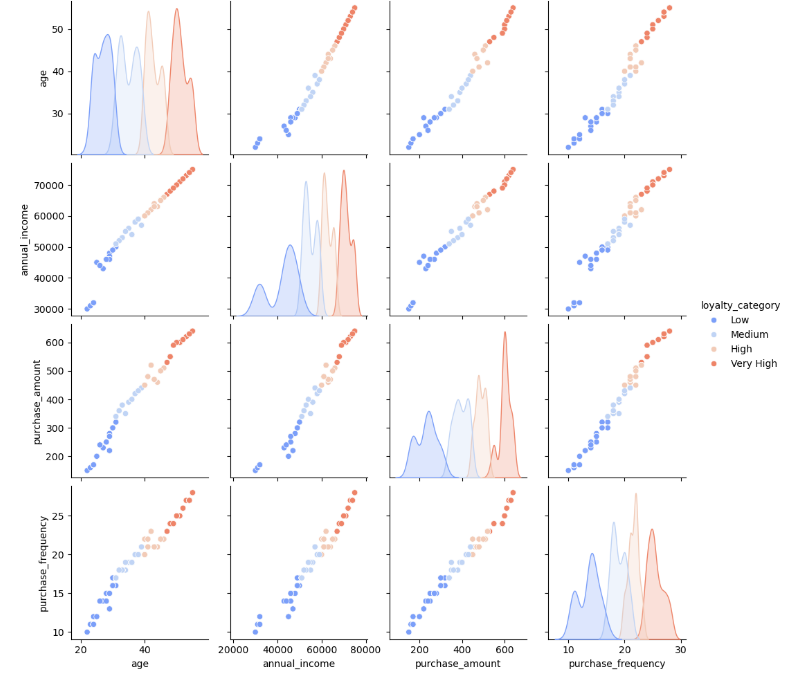
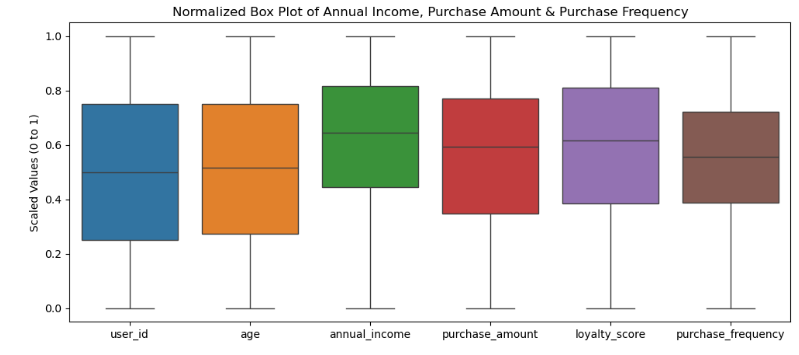
2. Exploratory Data Analysis
-
Used Seaborn, Matplotlib, and Pandas for:
-
Visualized distributions (histograms, boxplots)
-
-
-
 Correlation matrix (heatmap)
-
-
-
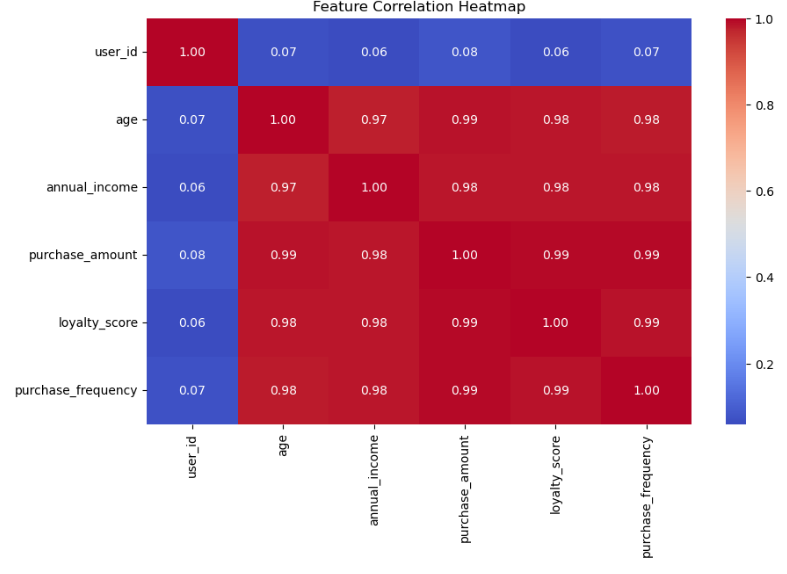 Checked for outliers and feature correlations
-
 Key Finding:
-
Annual Income and Purchase Amount showed strong positive correlation with Loyalty S
Model Building –
Used two regression techniques:
-
Linear Regression
-
Random Forest Regressor
Training/Testing Strategy:
-
Split dataset (train/test)
-
Scaled features
-
Evaluated with MSE and R²
Feature Importance
 Risks & Limitations –
- Only 238 entries, not scalable without more data
- Region may be biased (could all be from one store or area)
- No date info → we can’t tell if these purchases happened during holidays or sales
Despite these, the model provides a great framework for teams to start testing loyalty predictions with real business data.
To Conclude
This project showcases my ability to bridge data science, analytics, and business strategy, translating raw data into actionable insights that can influence real-world marketing and CRM decisions.
With more time and data, I would expand the dataset, incorporate time-based variables, and integrate LTV scoring to strengthen predictive accuracy. But even in its prototype form, this model demonstrates how a small set of well-chosen features can uncover high-impact opportunities for smarter targeting, stronger customer retention, and measurable ROI.